library(mandala)
library(sommer)
library(dplyr)
library(ggplot2)
library(tidyr)

get_sommer_vc <- function(varcomp, term) {
  hits <- which(startsWith(rownames(varcomp), paste0(term, ".")) | rownames(varcomp) == term)
  if (length(hits) != 1L) {
    stop("Expected exactly one Sommer variance component for term: ", term)
  }
  varcomp[hits, "VarComp"]
}

get_mandala_vc <- function(varcomp, term) {
  hits <- which(varcomp$component == term)
  if (length(hits) != 1L) {
    stop("Expected exactly one Mandala variance component for term: ", term)
  }
  varcomp$estimate[hits]
}Comparison: Mandala vs Sommer
Side-by-side analysis for quantitative genetics applications
Overview
This tutorial compares the mandala package with the popular sommer package for analyzing agricultural field trials. Most examples use the same dataset in both packages and fit directly comparable models; where the package workflows differ, the comparison focuses on the closest practical analysis in each package and highlights where Mandala adds field-trial-specific workflow helpers.
NoteWhat you’ll learn
- Key differences between Mandala and Sommer
- Side-by-side analysis of comparable MET, GBLUP, and GxE workflows
- Variance component estimation comparison
- Heritability calculation methods for multi-environment data
- When to use each package
Background
Sommer Package
- Purpose: Mixed models for plant breeding and quantitative genetics
- Key Features:
- Multivariate and univariate mixed models
- Flexible covariance structures and relationship matrices
- Genomic prediction and broader quantitative-genetics workflows
- G×E modeling, including reduced-rank / FA-style structures
- Spatial modeling, including 2D spline support
- Primary Use: Quantitative genetics, genomic prediction, and flexible mixed-model analysis for breeding data
Mandala Package
- Purpose: Mixed-model analysis for agricultural field trials
- Key Features:
- Streamlined workflow for standard field-trial designs
- Direct spatial formula terms and built-in diagnostics
- Genomic prediction helpers for GBLUP workflows
- Dedicated factor-analytic G×E workflow with post-fit visualization
- Unified heritability estimation
- Primary Use: Field-trial analysis, variety testing, and genomic prediction within breeding trial workflows
Loading Packages
Example 1: Multi-Environment Trial
Data Setup
set.seed(456)
n_genotypes <- 20
n_envs <- 3
n_blocks <- 3

met_data <- expand.grid(
  genotype = factor(paste0("G", sprintf("%02d", 1:n_genotypes))),
  env = factor(paste0("E", 1:n_envs)),
  block = factor(paste0("B", 1:n_blocks))
)

# True variance components
true_var_g <- 500
true_var_gxe <- 200
true_var_error <- 400

# Simulate
met_data$yield <- 6000 +
  rnorm(n_genotypes, 0, sqrt(true_var_g))[as.numeric(met_data$genotype)] +
  rnorm(n_envs, 0, 300)[as.numeric(met_data$env)]

# Add GxE
gxe <- matrix(rnorm(n_genotypes * n_envs, 0, sqrt(true_var_gxe)),
              n_genotypes, n_envs)
met_data$yield <- met_data$yield +
  gxe[cbind(as.numeric(met_data$genotype), as.numeric(met_data$env))]

# Add block(env) and error
met_data$env_block <- factor(paste0(met_data$env, "_", met_data$block))
met_data$yield <- met_data$yield +
  rnorm(n_envs * n_blocks, 0, 50)[as.numeric(met_data$env_block)] +
  rnorm(nrow(met_data), 0, sqrt(true_var_error))

head(met_data)
genotype env block yield env_block
1 G01 E1 B1 5861.335 E1_B1
2 G02 E1 B1 5902.917 E1_B1
3 G03 E1 B1 5880.556 E1_B1
4 G04 E1 B1 5822.048 E1_B1
5 G05 E1 B1 5856.848 E1_B1
6 G06 E1 B1 5885.062 E1_B1Mandala MET Analysis
mandala_met <- mandala(
  fixed  = yield ~ env,
  random = ~ genotype + genotype:env + env:block,
  data   = met_data,
  verbose = FALSE
)

# Variance components
mandala_met_vc <- mandala_met$varcomp
print("Mandala MET Variance Components:")
[1] "Mandala MET Variance Components:"print(mandala_met_vc) component estimate std.error z.ratio bound %ch
1 genotype 500.1421 192.81468 2.593900 P NA
2 genotype:env 128.0159 65.26314 1.961534 P NA
3 env:block 1347.2889 790.33649 1.704703 P NA
4 R.sigma2 432.1032 57.23323 7.549865 P NA# Extract components
var_g_mandala_met <- get_mandala_vc(mandala_met_vc, "genotype")
var_gxe_mandala_met <- get_mandala_vc(mandala_met_vc, "genotype:env")
var_e_mandala_met <- get_mandala_vc(mandala_met_vc, "R.sigma2")
# Entry-mean heritability across environments
h2_met_mandala <- var_g_mandala_met /
(var_g_mandala_met + var_gxe_mandala_met / n_envs + var_e_mandala_met / (n_envs * n_blocks))
cat("\nMandala Entry-mean heritability:", round(h2_met_mandala, 3), "\n")
Mandala Entry-mean heritability: 0.847 Sommer MET Analysis
sommer_met <- mmer(
  fixed  = yield ~ env,
  random = ~ genotype + genotype:env + env:block,
  data   = met_data,
  verbose = FALSE
)

# Variance components
met_vc <- summary(sommer_met)$varcomp
print("Sommer MET Variance Components:")
[1] "Sommer MET Variance Components:"print(met_vc) VarComp VarCompSE Zratio Constraint
genotype.yield-yield 500.1213 192.74417 2.594742 Positive
genotype:env.yield-yield 127.6429 65.18364 1.958205 Positive
env:block.yield-yield 1347.2640 790.20255 1.704960 Positive
units.yield-yield 432.1280 57.23833 7.549626 Positive# Extract components
var_g <- get_sommer_vc(met_vc, "genotype")
var_gxe <- get_sommer_vc(met_vc, "genotype:env")
var_e <- get_sommer_vc(met_vc, "units")
# Entry-mean heritability across environments
h2_met <- var_g / (var_g + var_gxe/n_envs + var_e/(n_envs * n_blocks))
cat("\nEntry-mean heritability:", round(h2_met, 3), "\n")
Entry-mean heritability: 0.847 MET Comparison
tibble(
  package = c("Mandala", "Sommer"),
  genotype_variance = c(var_g_mandala_met, var_g),
  gxe_variance = c(var_gxe_mandala_met, var_gxe),
  residual_variance = c(var_e_mandala_met, var_e),
  entry_mean_h2 = c(h2_met_mandala, h2_met)
)
# A tibble: 2 × 5
package genotype_variance gxe_variance residual_variance entry_mean_h2
<chr> <dbl> <dbl> <dbl> <dbl>
1 Mandala 500. 128. 432. 0.847
2 Sommer 500. 128. 432. 0.847Example 2: Spatial Analysis
This direct comparison starts with the same row and column random-effects adjustment in both packages. For spline-based spatial modeling, Sommer also provides spl2Dc() via mmes(), while Mandala also supports dedicated ar1() and pspline2D(...) spatial formula terms.
set.seed(789)
n_rows <- 10
n_cols <- 10

spatial_data <- data.frame(
  row = rep(1:n_rows, each = n_cols),
  col = rep(1:n_cols, times = n_rows),
  genotype = factor(sample(paste0("G", 1:25), n_rows * n_cols, replace = TRUE))
)

# Add spatial trend + genotype effects + error
gen_eff <- setNames(rnorm(25, 0, 300), paste0("G", 1:25))
spatial_data$yield <- 5000 +
  gen_eff[spatial_data$genotype] +
  30 * spatial_data$row - 20 * spatial_data$col +
  rnorm(nrow(spatial_data), 0, 200)
Visualize Field Pattern
ggplot(spatial_data, aes(x = col, y = row, fill = yield)) +
  geom_tile() +
  scale_fill_gradient2(low = "#2E6B8A", mid = "#FAF8F5", high = "#9B5B5B",
                       midpoint = mean(spatial_data$yield)) +
  coord_equal() +
  theme_minimal() +
  labs(title = "Field Map - Spatial Trend Visible",
       x = "Column", y = "Row")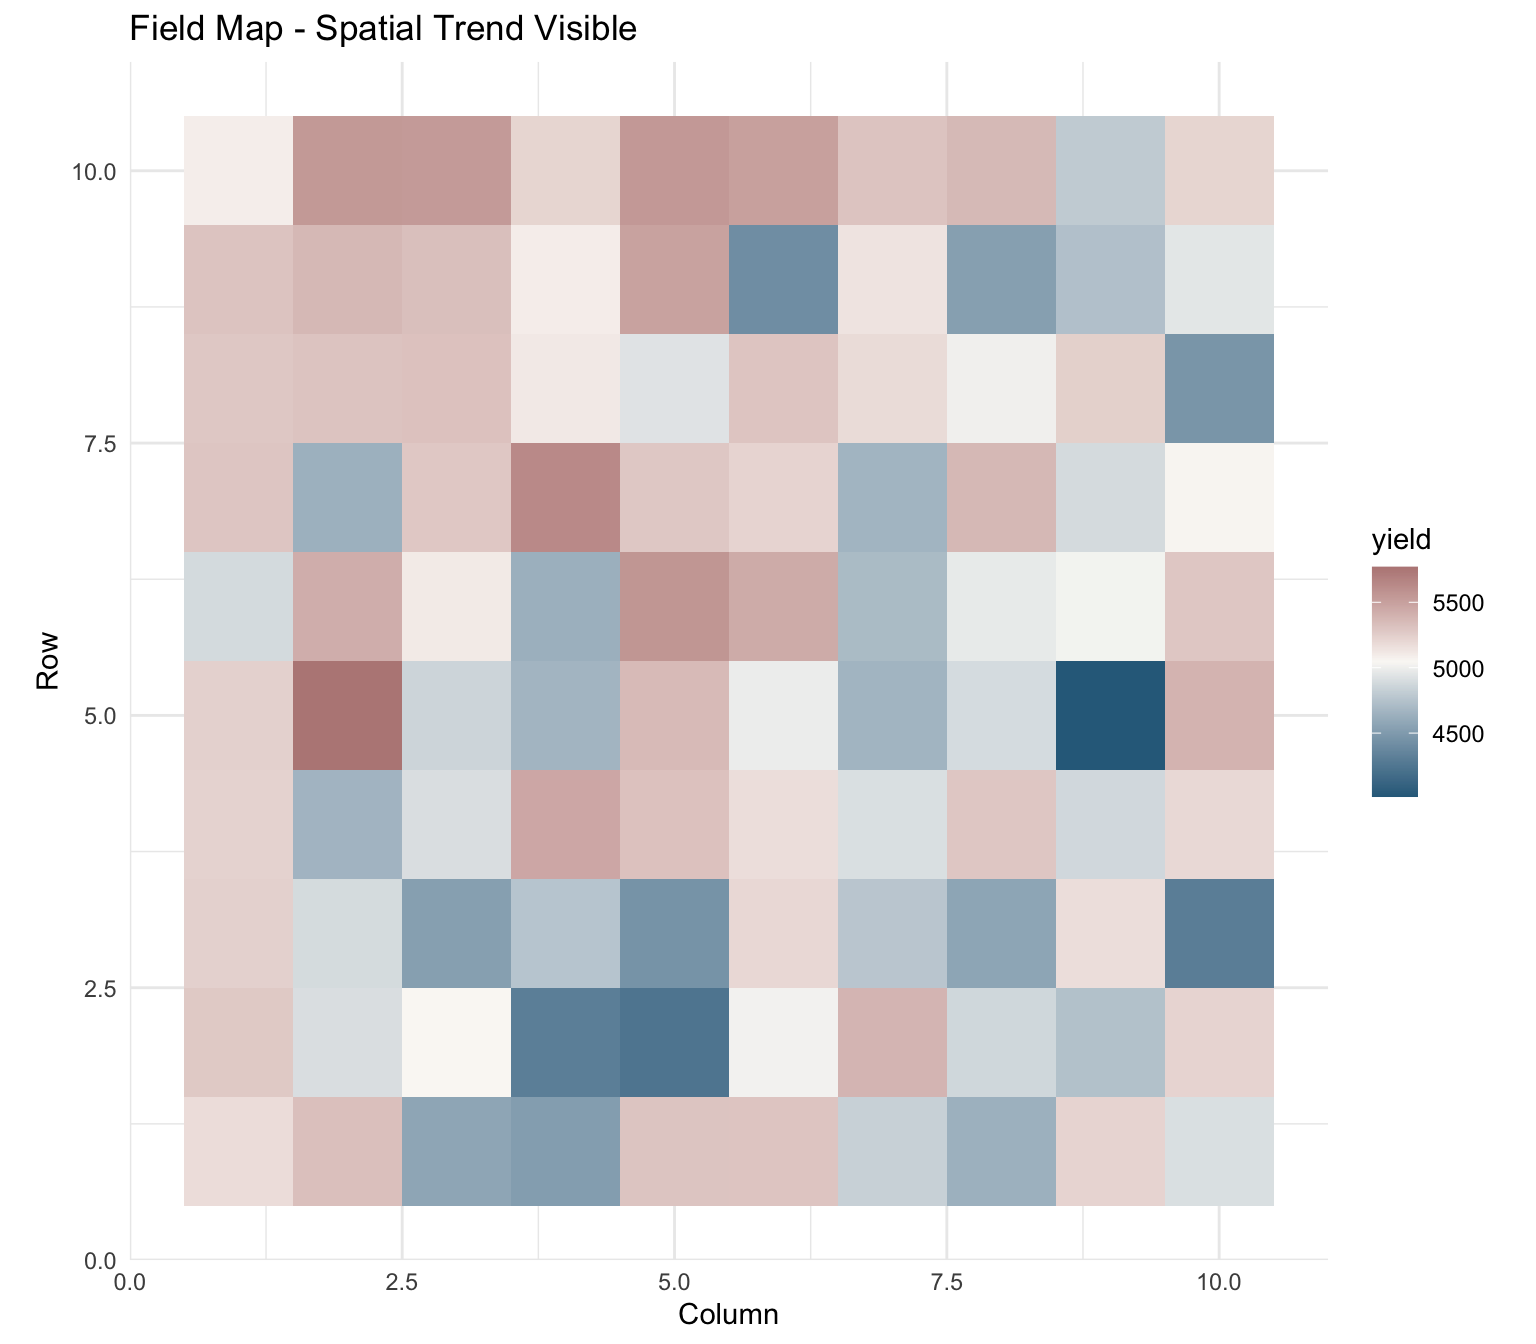
Sommer with Row-Column Effects
spatial_data$row_f <- factor(spatial_data$row)
spatial_data$col_f <- factor(spatial_data$col)

sommer_spatial <- mmer(
  fixed = yield ~ 1,
  random = ~ genotype + row_f + col_f,
  data = spatial_data,
  verbose = FALSE
)

print(summary(sommer_spatial)$varcomp)
VarComp VarCompSE Zratio Constraint
genotype.yield-yield 62242.1591 22296.159 2.7916091 Positive
row_f.yield-yield 11391.4155 8201.081 1.3890139 Positive
col_f.yield-yield 490.7583 3227.847 0.1520389 Positive
units.yield-yield 47209.7972 8710.007 5.4201793 PositiveMandala with the Same Row-Column Effects
mandala_spatial <- mandala(
  fixed  = yield ~ 1,
  random = ~ genotype + row_f + col_f,
  data   = spatial_data,
  verbose = FALSE
)

print(mandala_spatial$varcomp)
component estimate std.error z.ratio bound %ch
1 genotype 62235.6785 22303.624 2.7903842 P NA
2 row_f 11381.7313 8197.537 1.3884331 P NA
3 col_f 500.9914 3232.146 0.1550027 P NA
4 R.sigma2 47234.6463 8718.454 5.4177778 P NASpatial Comparison
sommer_spatial_vc <- summary(sommer_spatial)$varcomp
mandala_spatial_vc <- mandala_spatial$varcomp

tibble(
  package = c("Mandala", "Sommer"),
  genotype_variance = c(get_mandala_vc(mandala_spatial_vc, "genotype"),
                        get_sommer_vc(sommer_spatial_vc, "genotype")),
  row_variance = c(get_mandala_vc(mandala_spatial_vc, "row_f"),
                   get_sommer_vc(sommer_spatial_vc, "row_f")),
  col_variance = c(get_mandala_vc(mandala_spatial_vc, "col_f"),
                   get_sommer_vc(sommer_spatial_vc, "col_f")),
  residual_variance = c(get_mandala_vc(mandala_spatial_vc, "R.sigma2"),
                        get_sommer_vc(sommer_spatial_vc, "units"))
)
# A tibble: 2 × 5
package genotype_variance row_variance col_variance residual_variance
<chr> <dbl> <dbl> <dbl> <dbl>
1 Mandala 62236. 11382. 501. 47235.
2 Sommer 62242. 11391. 491. 47210.If field rows and columns are expected to be correlated rather than independent, Mandala can replace row_f + col_f with ar1(row_f) + ar1(col_f) directly inside the formula.
Example 3: Genomic Prediction (GBLUP)
Both packages support GBLUP with relationship matrices. To make the comparison meaningful, the phenotype below is simulated from marker-derived genomic signal, so a positive cross-validation result is expected.
Data Setup
set.seed(123)
n_geno <- 50
n_markers <- 200
geno_ids <- paste0("G", 1:n_geno)

# Simulate marker data and build a GRM
M <- matrix(rbinom(n_geno * n_markers, 2, 0.5), n_geno, n_markers)
M_centered <- scale(M, center = TRUE, scale = FALSE)
G <- tcrossprod(M_centered) / n_markers
diag(G) <- diag(G) + 1e-6
rownames(G) <- colnames(G) <- geno_ids

# Simulate phenotype with genomic signal driven by marker effects
qtl_idx <- 1:20
marker_effects <- rnorm(length(qtl_idx), 0, 1)
genomic_signal <- as.numeric(M_centered[, qtl_idx, drop = FALSE] %*% marker_effects)
genomic_signal <- as.numeric(scale(genomic_signal))

gblup_data <- data.frame(
  geno = factor(geno_ids, levels = geno_ids),
  yield = 5000 + 180 * genomic_signal + rnorm(n_geno, 0, 120)
)

head(gblup_data)
geno yield
1 G1 4836.758
2 G2 4893.197
3 G3 5053.719
4 G4 4755.437
5 G5 4813.896
6 G6 4727.007Sommer GBLUP
# Sommer GBLUP
sommer_gblup <- mmer(
  fixed = yield ~ 1,
  random = ~ vsr(geno, Gu = G),
  data = gblup_data,
  verbose = FALSE
)

# Extract GEBVs
gebvs_sommer <- tibble(
  geno = names(sommer_gblup$U$`u:geno`$yield),
  gebv = unname(sommer_gblup$U$`u:geno`$yield)
)
head(gebvs_sommer)
# A tibble: 6 × 2
geno gebv
<chr> <dbl>
1 G1 -148.
2 G2 -89.0
3 G3 52.9
4 G4 -215.
5 G5 -165.
6 G6 -250. Mandala GBLUP
# Mandala high-level GBLUP wrapper
invisible(capture.output(
  mandala_gp_fit <- mandala_gp(
    fixed     = yield ~ 1,
    random    = ~ GM(geno, Gmat),
    gen_col   = "geno",
    data      = gblup_data,
    GRM       = G,
    verbose   = FALSE
  )
))

gebvs_mandala <- mandala_gp_fit$gebv %>%
  transmute(geno = id, gebv)
head(gebvs_mandala)
geno gebv
1 G1 -147.41641
2 G10 -447.29152
3 G11 -268.57688
4 G12 -69.64077
5 G13 157.34041
6 G14 -85.00044# Built-in cross-validation helper
invisible(capture.output(
cv_results <- mandala_gp_cv(
fixed = yield ~ 1,
random = ~ GM(geno, Gmat),
gen_col = "geno",
data = gblup_data,
GRM = G,
k_folds = 5,
n_reps = 3,
verbose = FALSE
)
))
mean(cv_results$by_fold$pred_ability)[1] 0.365165GBLUP Comparison
gblup_compare <- inner_join(
  gebvs_sommer %>% rename(sommer_gebv = gebv),
  gebvs_mandala %>% rename(mandala_gebv = gebv),
  by = "geno"
)

cat(sprintf("GEBV correlation: %.4f\n", cor(gblup_compare$sommer_gebv, gblup_compare$mandala_gebv)))
GEBV correlation: 1.0000cat(sprintf("GEBV RMSE: %.4f\n", sqrt(mean((gblup_compare$sommer_gebv - gblup_compare$mandala_gebv)^2))))GEBV RMSE: 0.3476head(gblup_compare)# A tibble: 6 × 3
geno sommer_gebv mandala_gebv
<chr> <dbl> <dbl>
1 G1 -148. -147.
2 G2 -89.0 -88.7
3 G3 52.9 52.8
4 G4 -215. -214.
5 G5 -165. -165.
6 G6 -250. -249. Example 4: Structured G×E Models
Mandala provides a dedicated factor-analytic G×E workflow for field-trial analysis. Sommer can also fit reduced-rank or FA-style G×E structures through the newer mmes() variance-structure machinery, but that workflow is more manual. This tutorial uses a diagonal G×E Sommer example as a simpler baseline and then shows Mandala’s higher-level FA() workflow.
Sommer Diagonal G×E Model
# Sommer diagonal G×E structure
sommer_diag <- mmer(
  fixed = yield ~ env,
  random = ~ vsr(dsr(env), geno),  # Diagonal G×E
  data = met_data,
  verbose = FALSE
)
Sommer can also fit reduced-rank or FA-style structures with mmes() and vsm(rrm(...), ism(...)), but that requires a more manual specification than the diagonal mmer() example shown here.
Mandala Factor-Analytic G×E Model
# Mandala provides dedicated FA() syntax
fa_model <- mandala(
  fixed  = yield ~ env + geno,
  random = ~ FA(geno, env, k = 2) + by(env):ar1(row) + by(env):ar1(col),
  data   = met_data,
  verbose = FALSE
)

# Built-in visualization
fa_biplot(fa_model)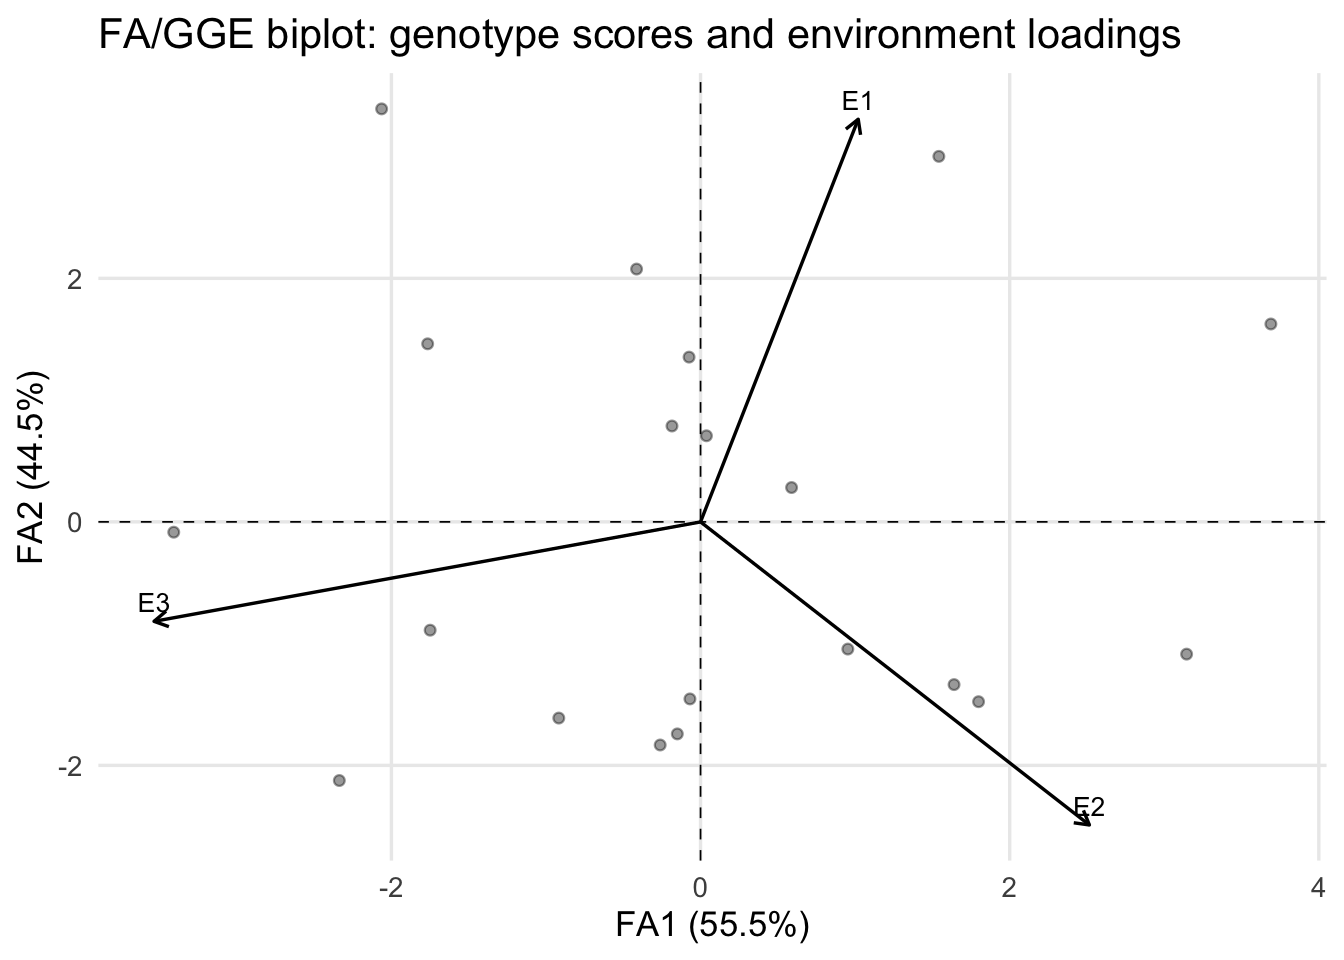
fa_biplot(fa_model, type = "which_won_where")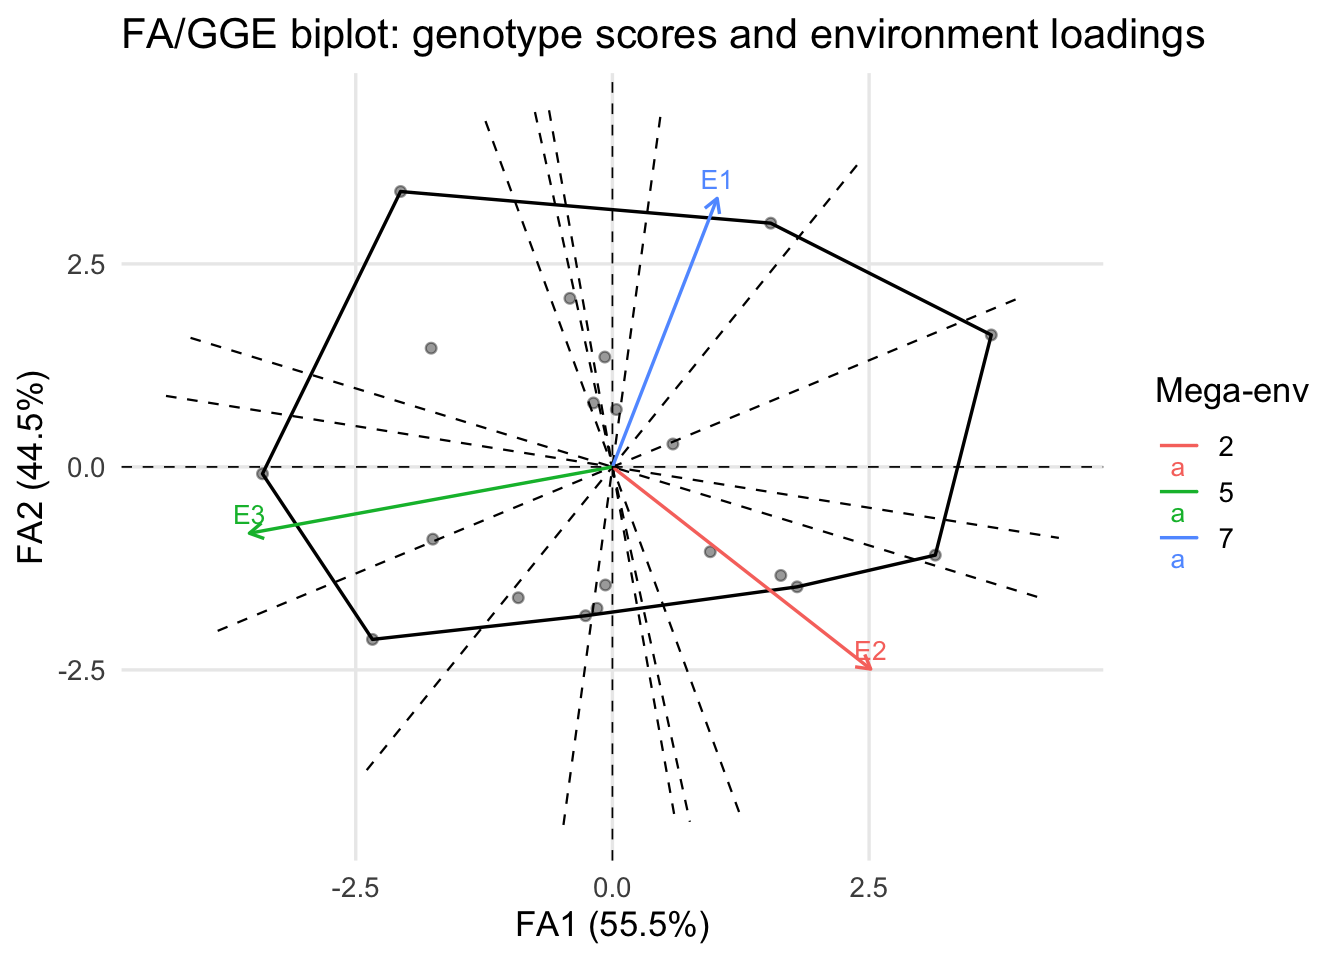
fa_heatmap(fa_model)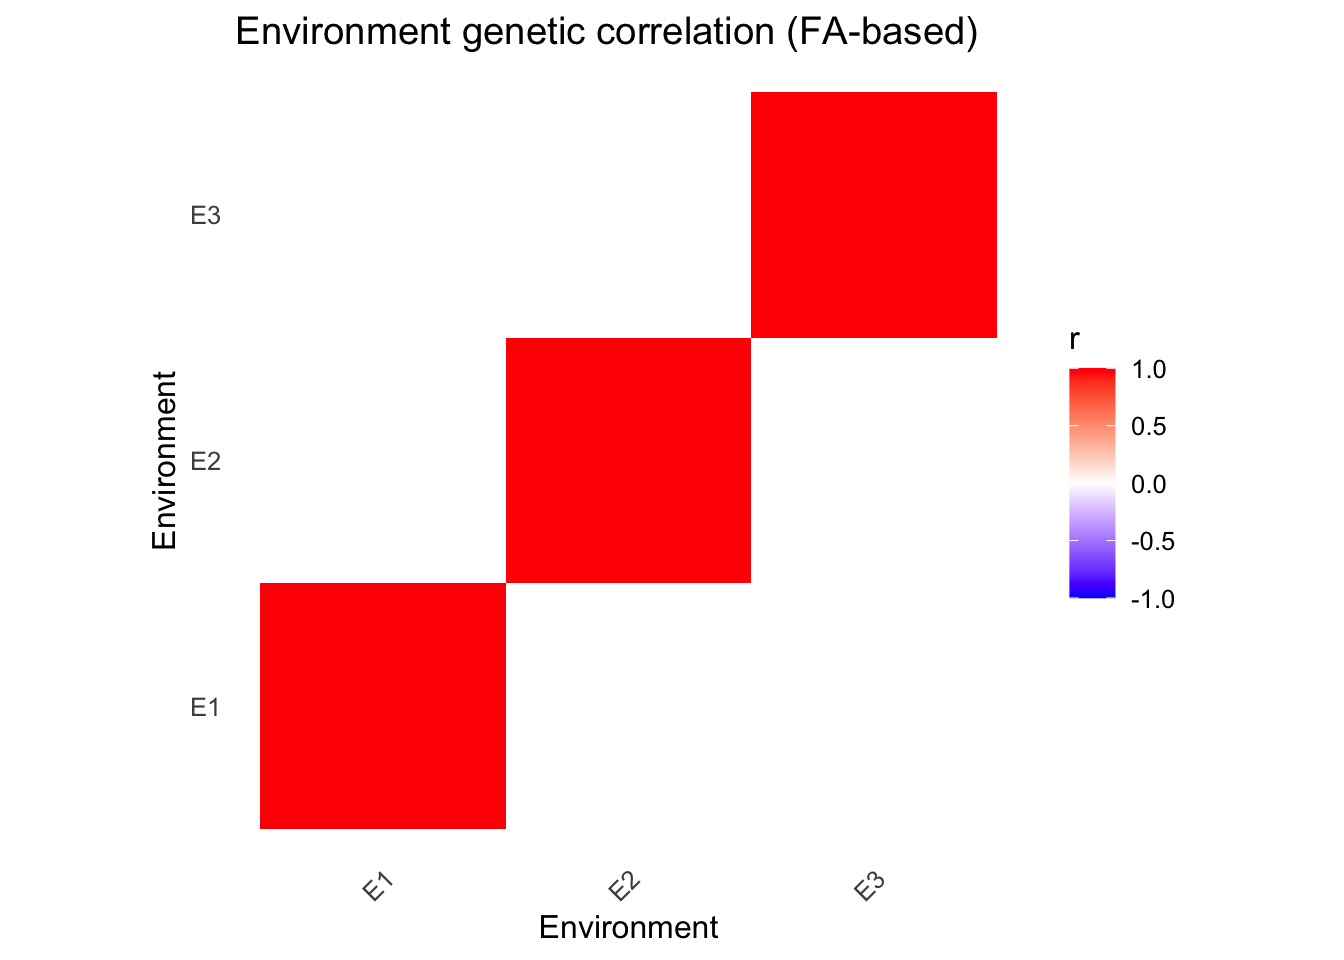
# Extract environment correlations
fa_env_cor(fa_model)
E1 E2 E3
E1 1.000000e+00 2.253465e-14 2.253464e-14
E2 2.253465e-14 1.000000e+00 4.506688e-14
E3 2.253464e-14 4.506688e-14 1.000000e+00# Reliability estimates
fa_reliability(fa_model) geno env blup se pev var_env reliability
1 G01 E1 7.76446633 18.21492 197370.6 4437.611 0
2 G02 E1 -0.67666849 18.21514 197375.4 4437.611 0
3 G03 E1 4.18935571 18.22352 197557.0 4437.611 0
4 G04 E1 -8.59831775 18.22352 197557.0 4437.611 0
5 G05 E1 16.10555048 18.22500 197589.2 4437.611 0
6 G06 E1 20.26744882 18.22500 197589.2 4437.611 0
7 G07 E1 -4.37516375 18.20491 197153.7 4437.611 0
8 G08 E1 4.25653605 18.20491 197153.7 4437.611 0
9 G09 E1 -11.14964159 18.20287 197109.6 4437.611 0
10 G10 E1 -4.84037536 18.20287 197109.6 4437.611 0
11 G11 E1 -16.58236399 18.20287 197109.6 4437.611 0
12 G12 E1 -11.03960703 18.20287 197109.6 4437.611 0
13 G13 E1 2.70244363 18.20491 197153.7 4437.611 0
14 G14 E1 5.34808793 18.20491 197153.7 4437.611 0
15 G15 E1 -5.37377101 18.22500 197589.2 4437.611 0
16 G16 E1 -10.41954420 18.22500 197589.2 4437.611 0
17 G17 E1 -8.32977427 18.22352 197557.0 4437.611 0
18 G18 E1 11.35664246 18.22352 197557.0 4437.611 0
19 G19 E1 16.05904086 18.21514 197375.4 4437.611 0
20 G20 E1 -6.62142511 18.21514 197375.4 4437.611 0
21 G01 E2 -6.25531319 18.21494 197371.0 4437.612 0
22 G02 E2 18.70842985 18.21516 197375.8 4437.612 0
23 G03 E2 -2.93347984 18.22353 197557.4 4437.612 0
24 G04 E2 6.07621387 18.22353 197557.4 4437.612 0
25 G05 E2 9.22922326 18.22502 197589.6 4437.612 0
26 G06 E2 -6.33608228 18.22502 197589.6 4437.612 0
27 G07 E2 8.80883117 18.20492 197154.1 4437.612 0
28 G08 E2 -4.27426303 18.20492 197154.1 4437.612 0
29 G09 E2 6.88270781 18.20288 197109.9 4437.612 0
30 G10 E2 13.13581743 18.20288 197109.9 4437.612 0
31 G11 E2 -1.04068785 18.20288 197109.9 4437.612 0
32 G12 E2 3.00428774 18.20288 197109.9 4437.612 0
33 G13 E2 1.37390772 18.20492 197154.1 4437.612 0
34 G14 E2 -14.24390095 18.20492 197154.1 4437.612 0
35 G15 E2 14.45490564 18.22502 197589.6 4437.612 0
36 G16 E2 6.97489333 18.22502 197589.6 4437.612 0
37 G17 E2 -3.85278747 18.22353 197557.4 4437.612 0
38 G18 E2 -10.94551802 18.22353 197557.4 4437.612 0
39 G19 E2 -24.03085888 18.21516 197375.8 4437.612 0
40 G20 E2 -14.73905417 18.21516 197375.8 4437.612 0
41 G01 E3 -1.47438396 18.21494 197371.0 4437.613 0
42 G02 E3 -18.03152530 18.21516 197375.8 4437.613 0
43 G03 E3 -1.25562123 18.22353 197557.4 4437.613 0
44 G04 E3 2.52211745 18.22353 197557.4 4437.613 0
45 G05 E3 -25.33490690 18.22502 197589.6 4437.613 0
46 G06 E3 -13.93141203 18.22502 197589.6 4437.613 0
47 G07 E3 -4.43353401 18.20492 197154.1 4437.613 0
48 G08 E3 0.01778946 18.20492 197154.1 4437.613 0
49 G09 E3 4.26719175 18.20288 197109.9 4437.613 0
50 G10 E3 -8.29534210 18.20288 197109.9 4437.613 0
51 G11 E3 17.62316620 18.20288 197109.9 4437.613 0
52 G12 E3 8.03570324 18.20288 197109.9 4437.613 0
53 G13 E3 -4.07605301 18.20492 197154.1 4437.613 0
54 G14 E3 8.89603214 18.20492 197154.1 4437.613 0
55 G15 E3 -9.08117538 18.22502 197589.6 4437.613 0
56 G16 E3 3.44500408 18.22502 197589.6 4437.613 0
57 G17 E3 12.18295168 18.22353 197557.4 4437.613 0
58 G18 E3 -0.41108424 18.22353 197557.4 4437.613 0
59 G19 E3 7.97205696 18.21516 197375.8 4437.613 0
60 G20 E3 21.36083776 18.21516 197375.8 4437.613 0fa_reliability_by_env(fa_model) env mean_reliability n
1 E1 0 20
2 E2 0 20
3 E3 0 20# Factor scores and loadings
fa_geno_scores(fa_model) geno FA1 FA2 method
1 G01 -0.07430727 1.35320989 svd_from_ge_blups
2 G02 3.14463984 -1.08623221 svd_from_ge_blups
3 G03 0.03808185 0.70707267 svd_from_ge_blups
4 G04 -0.06862734 -1.45418159 svd_from_ge_blups
5 G05 3.68993234 1.62516399 svd_from_ge_blups
6 G06 1.54176417 3.00198635 svd_from_ge_blups
7 G07 0.95292860 -1.04470064 svd_from_ge_blups
8 G08 -0.18483763 0.78738085 svd_from_ge_blups
9 G09 -0.26119695 -1.83256024 svd_from_ge_blups
10 G10 1.64008687 -1.33650882 svd_from_ge_blups
11 G11 -2.33703499 -2.12434220 svd_from_ge_blups
12 G12 -0.91706031 -1.61135520 svd_from_ge_blups
13 G13 0.58893280 0.28200084 svd_from_ge_blups
14 G14 -1.76554018 1.46230897 svd_from_ge_blups
15 G15 1.79864126 -1.47693761 svd_from_ge_blups
16 G16 -0.15029916 -1.74150272 svd_from_ge_blups
17 G17 -1.74939550 -0.88961294 svd_from_ge_blups
18 G18 -0.41393083 2.07633652 svd_from_ge_blups
19 G19 -2.06327526 3.39200925 svd_from_ge_blups
20 G20 -3.40822723 -0.08473759 svd_from_ge_blupsfa_env_loadings(fa_model) FA1 FA2
E1 1e-05 0.000000e+00
E2 1e-05 9.999469e-06
E3 1e-05 9.999464e-06Key Differences Summary
| Aspect | Mandala | Sommer |
|---|---|---|
| Syntax | Simple formula interface | More verbose |
| Heritability | Built-in h2_estimates() |
Manual calculation |
| Spatial models | AR1, P-spline formula terms, variograms | Row/column effects, custom covariance, spl2Dc() via mmes() |
| GBLUP | GM() + mandala_gp() |
vsr(Gu=) |
| Structured G×E | Dedicated FA() workflow with biplots/heatmaps |
Diagonal and FA-style reduced-rank structures via mmer() / mmes(), with more manual setup |
| Two-stage workflows | Dedicated stage 1 / stage 2 helpers for breeding-trial workflows | Possible, but assembled manually from mmes() fits |
| Cross-validation | mandala_gp_cv() |
Manual |
| Multi-trait (multivariate) | No | Yes |
| Built-in visualization | FA plots, heatmaps, variograms | More manual |
When to Use Each
Use Mandala when:
- Standard field trial designs
- Field-trial spatial modeling with direct
ar1()orpspline2D(...)terms - Single-trait GBLUP workflows with built-in cross-validation
- Factor-analytic G×E with visualization
- Built-in two-stage MET and genomic workflows
- You want BLUEs, BLUPs, heritability, spatial adjustment, and G×E outputs in one field-trial-oriented workflow
- Quick heritability estimates
Use Sommer when:
- Multi-trait genomic prediction
- Complex custom covariance structures
- Reduced-rank / FA-style G×E with manual specification
- Spatial modeling through
mmer()/mmes()when you want lower-level control - Broader genetics workflows beyond Mandala’s current scope
- Already established sommer workflows
Additional Resources
Session Information
sessionInfo()R version 4.5.2 (2025-10-31)
Platform: aarch64-apple-darwin20
Running under: macOS Tahoe 26.1
Matrix products: default
BLAS: /System/Library/Frameworks/Accelerate.framework/Versions/A/Frameworks/vecLib.framework/Versions/A/libBLAS.dylib
LAPACK: /Library/Frameworks/R.framework/Versions/4.5-arm64/Resources/lib/libRlapack.dylib; LAPACK version 3.12.1
locale:
[1] C.UTF-8/C.UTF-8/C.UTF-8/C/C.UTF-8/C.UTF-8
time zone: America/New_York
tzcode source: internal
attached base packages:
[1] stats graphics grDevices utils datasets methods base
other attached packages:
[1] tidyr_1.3.1 ggplot2_4.0.0 dplyr_1.1.4 sommer_4.4.4 enhancer_1.1.0
[6] crayon_1.5.3 MASS_7.3-65 Matrix_1.7-4 mandala_1.1.0
loaded via a namespace (and not attached):
[1] gtable_0.3.6 jsonlite_2.0.0 compiler_4.5.2 tidyselect_1.2.1
[5] Rcpp_1.1.0 splines2_0.5.4 scales_1.4.0 yaml_2.3.10
[9] fastmap_1.2.0 lattice_0.22-7 R6_2.6.1 patchwork_1.3.2
[13] labeling_0.4.3 generics_0.1.4 knitr_1.50 htmlwidgets_1.6.4
[17] ggrepel_0.9.6 tibble_3.3.0 pillar_1.11.1 RColorBrewer_1.1-3
[21] rlang_1.1.6 utf8_1.2.6 xfun_0.54 S7_0.2.0
[25] cli_3.6.5 withr_3.0.2 magrittr_2.0.4 digest_0.6.37
[29] grid_4.5.2 lifecycle_1.0.4 ggdendro_0.2.0 vctrs_0.6.5
[33] evaluate_1.0.5 glue_1.8.0 farver_2.1.2 purrr_1.1.0
[37] rmarkdown_2.30 tools_4.5.2 pkgconfig_2.0.3 htmltools_0.5.8.1